

A Bode plot is an invaluable tool in the realm of control systems. As a control system supplier, I've seen firsthand how these plots can offer a wealth of information that's crucial for understanding and optimizing system performance. In this blog, I'll break down the different types of information we can glean from a Bode plot, and explain why this knowledge is so important in the control system business.
1. Gain and Phase Information
Let's start with the basics: gain and phase. The gain plot on a Bode diagram shows how the magnitude of a system's output signal changes relative to the input signal at different frequencies. It's given in decibels (dB), which is a logarithmic scale. A positive gain means the output is larger than the input, while a negative gain indicates the output is smaller.
For example, if a control system is meant to amplify a signal, we'd expect to see a positive gain over the relevant frequency range on the Bode plot. On the flip - side, if the system is designed to attenuate a signal, like in some filtering applications, the gain will be negative.
The phase plot, on the other hand, tells us about the time delay between the input and output signals. It's measured in degrees. A phase shift of 0 degrees means the input and output are in sync, while a 180 - degree phase shift means they're completely out of phase. In control systems, phase information is super important because it can affect system stability. If the phase shift is too large at certain frequencies, the system might start to oscillate.
2. Bandwidth
Bandwidth is another key piece of information from a Bode plot. Simply put, it's the range of frequencies over which the system can operate effectively. Usually, the bandwidth is defined as the frequency range where the gain doesn't drop more than 3 dB from its maximum value.
For us as a control system supplier, understanding the bandwidth of a system is crucial. If a client needs a control system for an application that involves high - frequency signals, we need to ensure that the system has a wide enough bandwidth. For instance, in a communication system control, a wide bandwidth allows for the transmission of high - speed data. If the bandwidth is too narrow, the signal might get distorted, and the system won't work as expected.
3. System Stability
One of the most critical things we look at in a Bode plot is system stability. We can determine stability by looking at the gain margin and phase margin. The gain margin is the amount of additional gain that can be added to the system before it becomes unstable. It's measured at the frequency where the phase shift is 180 degrees. A larger gain margin means the system is more stable.
The phase margin is the amount of additional phase shift that the system can tolerate before it goes unstable. It's measured at the frequency where the gain is 0 dB. A good rule of thumb is that a phase margin of around 45 - 60 degrees and a gain margin of at least 6 dB are signs of a stable system.
In our control system supply business, we use these margins to assess whether a system will work reliably. If a client has a system that's on the verge of instability, we can use the Bode plot to recommend adjustments, such as adding a compensator to increase the phase or gain margin.
4. System Type and Order
The shape of the Bode plot can also tell us about the type and order of the control system. The system type is related to the number of integrators in the open - loop transfer function. A type 0 system has no integrators, a type 1 system has one integrator, and so on. The slope of the gain plot at low frequencies can give us an idea of the system type. For example, a type 0 system has a flat gain plot at low frequencies, while a type 1 system has a slope of - 20 dB/decade.
The system order is related to the number of poles and zeros in the transfer function. Higher - order systems tend to have more complex Bode plots, with more peaks, valleys, and steeper slopes. By analyzing the Bode plot, we can estimate the order of the system, which helps us in understanding its dynamic behavior. This is important when we're designing or selecting a control system for a specific application. For example, a high - order system might require more sophisticated control algorithms to achieve good performance.
5. Resonance and Anti - resonance
Resonance and anti - resonance are phenomena that show up clearly on a Bode plot. Resonance occurs when the system's response peaks at a particular frequency. This is usually due to the interaction between the system's poles and zeros. At resonance, the gain of the system can increase significantly, which might lead to large oscillations or even damage to the system if not properly controlled.
Anti - resonance, on the other hand, is the opposite. It's a frequency where the system's response dips to a minimum. Anti - resonance can be used to filter out unwanted frequencies in a control system.

As a control system supplier, we need to be aware of resonance and anti - resonance in a system. If a client's system is experiencing resonance, we can use the Bode plot to identify the resonant frequency and then recommend solutions, such as adding damping or changing the system's parameters.
Practical Applications in Our Control System Supply Business
Now, let's talk about how this information from Bode plots is used in our day - to - day business as a control system supplier.
When a client comes to us with a specific control system requirement, we first analyze their needs in terms of frequency response. We use Bode plots to design a system that meets their gain, phase, bandwidth, and stability requirements. For example, if a client needs a Handheld RF Remote Control, we'll design the control system to have the right gain and phase characteristics at the operating frequencies. This ensures that the remote control can send and receive signals accurately without interference.
We also use Bode plots for troubleshooting. If a client reports issues with their control system, such as instability or poor performance at certain frequencies, we can use the Bode plot of their system to diagnose the problem. For instance, if the system has a low gain margin, we can recommend adding a compensator to increase the stability.
In addition, we use Bode plots to compare different control system designs. By looking at the Bode plots of different systems, we can quickly see which one has better performance in terms of gain, phase, bandwidth, and stability. This helps us in selecting the best system for our clients.
Conclusion
In conclusion, a Bode plot is an incredibly powerful tool for us as a control system supplier. It provides a wealth of information about gain, phase, bandwidth, stability, system type and order, and resonance and anti - resonance. This information is essential for designing, troubleshooting, and selecting the right control systems for our clients.
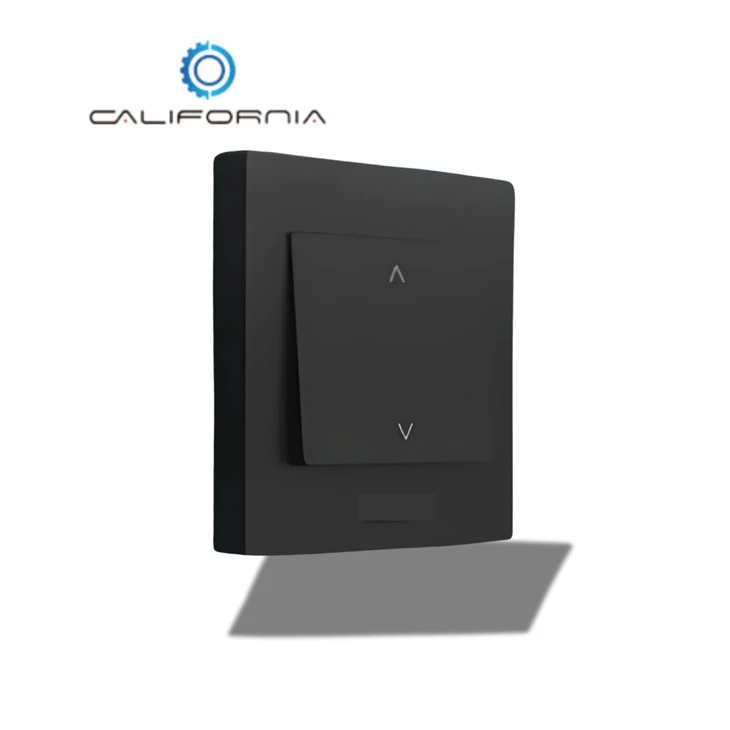
If you're in the market for a control system, whether it's a Handheld RF Remote Control, an External Radio Receiver, or a Motorized Blind Switch, we're here to help. Our team of experts will use Bode plots and other advanced techniques to ensure that you get a control system that meets your exact needs. Don't hesitate to reach out to us to start a conversation about your requirements. We're looking forward to working with you!
References
- Dorf, R. C., & Bishop, R. H. (2017). Modern Control Systems. Pearson.
- Franklin, G. F., Powell, J. D., & Emami - Naeini, A. (2014). Feedback Control of Dynamic Systems. Pearson.